Test Result Analysis
Testing a software application generates a large amount of data. Test cases are executed, defects are reported, and various outcomes such as pass, fail, or blocked are recorded. However, simply collecting this information is not enough. The real value of testing comes from interpreting these results and understanding what they reveal about the product’s quality and stability. This interpretation process is known as Test Result Analysis.
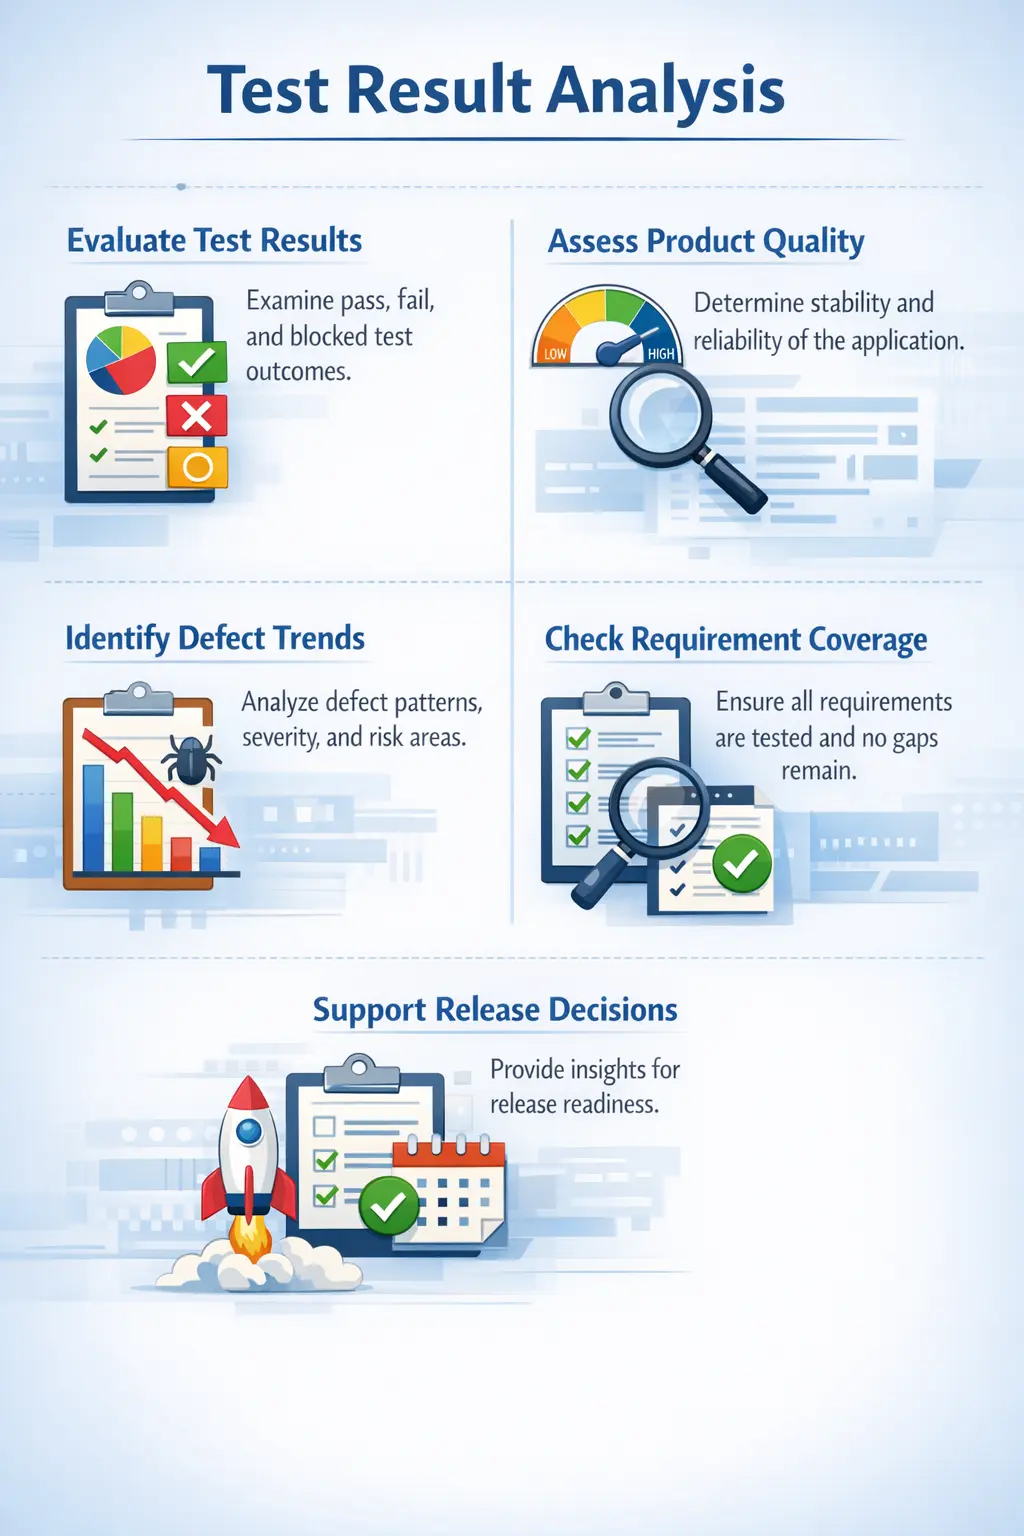
Test Result Analysis is the activity of examining test execution outcomes and defect data to evaluate product quality, identify risks, and support release decisions. It transforms raw testing results into meaningful insights that guide stakeholders in determining whether the software is ready for deployment.
Test Result Analysis answers a crucial question in the testing lifecycle:
“What do the test results tell us about quality and readiness?”
For manual testers, this activity goes beyond counting passed and failed test cases. It involves identifying patterns, understanding risk areas, and communicating quality insights clearly to project stakeholders.
Definition of Test Result Analysis
Test Result Analysis is the systematic evaluation of test execution outcomes to assess the quality of the application being tested. It involves interpreting data such as pass rates, defect severity, failure trends, and requirement coverage to determine the overall stability of the product.
This activity is usually performed after a significant portion of test execution is completed. Testers and QA leads review the results to identify patterns and trends that reveal deeper insights about system behavior.
Test result analysis helps answer questions such as whether the application is stable, whether critical functionality is functioning correctly, and whether any high-risk areas require further testing.
Rather than focusing only on individual test case outcomes, test result analysis focuses on the broader picture of product quality.
Purpose of Test Result Analysis
The main purpose of test result analysis is to evaluate the overall quality of the application. By analyzing the outcomes of executed test cases, testers can determine whether the system behaves reliably across different scenarios.
Another important purpose is identifying defect trends and risk hotspots. Certain modules may consistently produce failures, indicating deeper issues in design or implementation.
Test result analysis helps determine release readiness. Stakeholders rely on testing insights to decide whether the product can be safely deployed to production.
It also helps improve future testing strategies. By analyzing which areas produce the most defects, teams can refine test coverage in future cycles.
Finally, test result analysis provides meaningful insights to stakeholders. Executives and product owners may not review detailed test cases, but they rely on summarized insights to understand quality status.
Inputs to Test Result Analysis
Test result analysis relies on multiple sources of testing information.
Executed test cases are the primary input. The outcomes of these test cases provide direct evidence of system behavior.
Defect reports are another important input. They provide details about failures, severity levels, and affected modules.
Test execution reports summarize execution progress, pass rates, and blocked cases.
Requirement Traceability Matrix status shows whether all requirements have been tested and validated.
Severity and priority distribution of defects also provide valuable insight into the risk level of the application.
Combining these inputs allows testers to perform a comprehensive quality evaluation.
Pass and Fail Distribution
One of the first aspects evaluated during test result analysis is the distribution of passed, failed, and blocked test cases.
The percentage of passed test cases indicates how much functionality behaves as expected.
Failed test cases highlight areas where the application does not meet requirements.
Blocked test cases indicate situations where testing could not be completed due to external issues such as environment problems or missing data.
A high pass rate generally suggests stability, but it should not be interpreted in isolation.
Even a high pass rate may hide serious issues if critical functionality fails.
Therefore, pass and fail distribution must always be interpreted alongside defect severity and business impact.
Defect Trend Analysis
Defect trends provide insight into how the quality of the application evolves over time.
An increasing defect count during early testing phases is normal because testers are actively discovering issues.
However, if defect counts remain high toward the end of testing, it may indicate instability.
Testers also analyze whether new defects continue to appear in previously tested modules.
Another important aspect is distinguishing between newly reported defects and reopened defects.
Frequent reopening of defects may indicate incomplete fixes or misunderstanding of requirements.
Analyzing defect trends helps determine whether product quality is improving or deteriorating.
Severity Analysis
Not all defects have equal impact on the application.
Severity analysis examines the distribution of defects across severity levels such as critical, high, medium, and low.
Critical defects represent failures that prevent essential functionality from working.
High-severity defects significantly affect user workflows or business operations.
Medium and low defects typically represent minor issues that may not block releases.
Even a small number of critical defects can delay release decisions.
Severity analysis therefore provides a realistic assessment of business risk.
Requirement Coverage Analysis
Requirement coverage is another key component of test result analysis.
Testers evaluate how many requirements have been tested successfully.
If certain requirements remain untested due to blocked scenarios or incomplete testing, they represent potential risk.
The Requirement Traceability Matrix is often used to verify that each requirement has corresponding test cases and execution results.
Gaps in requirement coverage indicate incomplete validation.
Ensuring full coverage strengthens confidence in release decisions.
Identifying Root Patterns
Test result analysis goes beyond numbers to identify patterns in failures.
Repeated failures in the same module may indicate underlying architectural issues.
Multiple defects related to input validation may suggest poor requirement analysis or inadequate domain testing.
Failures caused by environment issues may reveal infrastructure instability.
By identifying these patterns, testers can provide valuable insights for improving development and testing processes.
Pattern analysis helps teams address root causes rather than treating defects individually.
Manual Tester’s Role in Test Result Analysis
Manual testers play a significant role in analyzing test results.
They review failed test cases carefully to determine whether failures are caused by defects, environment issues, or incorrect test data.
Testers identify patterns in failures and correlate them with specific modules or requirements.
They highlight potential risk areas rather than simply reporting numbers.
Testers also communicate insights clearly to QA leads and project stakeholders.
Their responsibility is to provide factual, evidence-based observations rather than assumptions.
Effective analysis requires both technical understanding and analytical thinking.
Example of Test Result Analysis
Consider a testing cycle with the following observations.
The pass rate is ninety-two percent, indicating that most test cases succeeded.
No critical defects have been reported, suggesting that core functionality is stable.
Two high-severity defects were discovered in the payment module.
Five test cases remain blocked due to environment issues.
Based on this analysis, the overall product appears stable, but the payment module represents a high-risk area.
Further validation and defect fixes may be required before release.
This example demonstrates how analysis converts raw data into meaningful insights.
Test Result Analysis vs Test Execution
Test execution and test result analysis serve different purposes in the testing lifecycle.
Test execution focuses on running test cases and identifying failures.
Test result analysis focuses on interpreting those failures and understanding their implications.
Execution produces raw outcomes such as pass or fail.
Analysis produces insights and recommendations.
Execution occurs during the testing process.
Analysis typically occurs after significant execution progress has been made.
Both activities are essential for effective quality assurance.
Common Mistakes in Test Result Analysis
One common mistake is focusing only on the overall pass percentage.
A high pass rate does not necessarily mean the system is stable.
Another mistake is ignoring the severity impact of defects.
Even a small number of critical defects may pose significant risk.
Some teams hide risks to present a positive quality status.
This practice undermines trust and may lead to production failures.
Another mistake is failing to correlate defects with specific requirements.
Proper analysis requires connecting failures with their root causes.
How Test Result Analysis Supports Decision-Making
Test result analysis provides critical information for decision-making.
Project managers and product owners rely on testing insights to make Go or No-Go decisions.
Analysis helps determine whether additional regression testing is required.
It assists in prioritizing defect fixes based on risk.
It also provides input for improving development and testing processes.
By presenting clear insights, testers enable informed decisions rather than guesswork.
Importance of Transparent Reporting
Transparency is essential in test result analysis.
Testers must present findings honestly, even if the results reveal significant risks.
Clear communication builds trust among stakeholders.
Accurate reporting ensures that decisions are based on reliable information.
Hiding or minimizing risks can lead to severe production failures.
Responsible testers always prioritize transparency.
Test Result Analysis in Agile Projects
In Agile environments, test result analysis is performed continuously throughout the sprint.
Testers analyze results during daily stand-up meetings and sprint reviews.
Defect trends are monitored regularly to detect emerging risks.
Continuous analysis enables quick adjustments in testing strategy.
Agile teams rely on fast feedback cycles to maintain product quality.
Looking Beyond Pass Percentage
Pass percentage is one of the most visible test result indicators, but it is also one of the easiest metrics to misunderstand. A test cycle may show that ninety-five percent of test cases passed, but that number alone does not prove the application is ready for release. If the failed five percent includes login, payment, order creation, or data security workflows, the product may still be high risk.
A high pass rate is useful only when the executed test cases cover important requirements and critical workflows. If most executed cases are low-risk UI checks while core business flows remain untested or blocked, the pass percentage gives false confidence. Test result analysis must therefore evaluate both quantity and quality of executed coverage.
Similarly, a lower pass percentage does not always mean the release is impossible. Early in a test cycle, failures are expected because testing is actively discovering issues. What matters is whether defects are understood, prioritized, fixed, re-tested, and reduced over time. A mature analysis considers trend, severity, business impact, and remaining risk instead of relying on one number.
Testers should explain pass percentage in context. A useful statement is not simply "ninety percent passed." A better statement is "ninety percent of planned cases are executed and passed, all smoke and critical flows passed, two medium defects remain in non-critical reporting, and three low-priority cases are blocked due to test data." This gives stakeholders a more accurate quality picture.
Analyzing Failed Test Cases
Failed test cases deserve careful examination because not every failure has the same meaning. Some failures represent real application defects. Others may be caused by incorrect test data, outdated test cases, environment issues, incomplete configuration, or misunderstood requirements. Test result analysis should separate these causes before drawing conclusions about product quality.
The first step is to confirm whether the failure is reproducible. A reproducible failure with correct data and valid preconditions usually indicates a defect. An intermittent failure may point to timing, performance, integration, or environment instability. A non-reproducible failure still needs attention, but it should be reported with the right uncertainty and evidence.
The second step is to map failures to modules and requirements. If failed cases are scattered randomly across low-risk areas, the product may still be relatively stable. If failures cluster around a critical module, the risk is higher. For example, multiple failures in payment processing are more serious than several unrelated cosmetic failures in rarely used screens.
Failed test case analysis should also examine whether failures are new or repeated. Repeated failures may indicate unresolved root causes or poor fixes. New failures in previously stable areas may indicate regression caused by recent changes. This distinction helps the team decide whether to focus on defect resolution, regression testing, or root cause analysis.
Analyzing Blocked Test Cases
Blocked test cases are often underestimated in test result analysis. A blocked case is not a pass and not a fail; it represents unknown quality. If many important cases are blocked, the team does not have enough evidence to make a confident release decision. Blocked cases should therefore be treated as risk indicators.
Common reasons for blocked cases include environment downtime, missing test data, unavailable third-party services, unresolved blocking defects, access issues, incomplete builds, and unclear requirements. The cause of blocking matters because each cause requires a different response. Environment blockers need infrastructure support, data blockers need preparation, and requirement blockers need clarification.
Blocked cases should be categorized by business impact. A blocked low-priority cosmetic test may not affect release readiness much. A blocked payment, login, user registration, security, or compliance test is a major concern. Test result analysis should highlight critical blocked areas instead of merely counting blocked cases.
Testers should communicate whether blocked cases can be executed later, need escalation, or require release risk acceptance. If a case remains blocked at the end of testing, stakeholders must understand what functionality was not validated. Transparent analysis prevents hidden risk from moving into production.
Analyzing Defect Severity and Priority Together
Severity and priority are both important, but they answer different questions. Severity explains how serious the defect impact is. Priority explains how urgently the defect should be fixed. Test result analysis becomes stronger when both are considered together.
A critical severity defect usually affects core functionality, data integrity, security, or system availability. Such defects often block release. A high-priority defect must be fixed quickly because it affects business timelines, customer visibility, or release commitments. Sometimes a low-severity defect can have high priority, such as a spelling mistake on a public marketing page before launch.
Analyzing severity without priority can mislead the team. A few medium defects in a core customer workflow may deserve more attention than several low defects in internal admin screens. Similarly, a severe defect in an out-of-scope feature may not block the current release if the feature is not being delivered. Business context matters.
A good test result analysis report should summarize defects by severity, priority, affected module, and release impact. It should clearly identify which defects are release blockers, which defects can be deferred with approval, and which defects require monitoring. This turns defect data into actionable release insight.
Defect Clustering and Hotspot Identification
Defect clustering means defects are concentrated in certain modules, workflows, components, or requirement areas. This is common in software projects. A small number of complex or frequently changed areas often produce a large number of defects. Test result analysis should identify these hotspots because they indicate higher risk.
A defect hotspot may be a newly developed feature, a complex business rule, an integration point, a module with many recent changes, or an area with unclear requirements. For example, if most defects appear in checkout, payment, and invoice generation, the order processing flow should be treated as a high-risk area even if many unrelated test cases pass.
Hotspot identification helps improve testing strategy. Testers may decide to increase regression coverage, perform exploratory testing, review requirements again, involve developers for technical analysis, or schedule additional business validation. Without hotspot analysis, teams may treat all defects as isolated incidents and miss the broader pattern.
Defect clustering also supports process improvement. If input validation defects repeatedly appear across modules, the team may need better validation standards. If reopened defects cluster around one feature, the fix process may need improvement. Test result analysis can therefore improve both product quality and team practices.
Requirement-Level Result Analysis
Requirement-level analysis evaluates quality from the perspective of business requirements rather than only test cases. This is important because one requirement may have several test cases. If most cases pass but one critical case fails, the requirement may still be incomplete or risky.
The Requirement Traceability Matrix helps connect requirements to test execution results. For each requirement, testers can determine whether related test cases passed, failed, were blocked, or were not executed. This gives stakeholders a clear view of requirement readiness.
Requirement-level analysis is especially useful for release decisions. A product owner may not need to know every individual test case result, but they need to know whether login, payment, reporting, search, user management, and compliance requirements are ready. Grouping results by requirement makes reporting more business-friendly.
Untested requirements should be highlighted clearly. A requirement with no execution evidence represents unknown risk. If the requirement is low priority, the business may accept the risk. If it is critical, execution must be completed before release confidence can be established.
Analyzing Regression Test Results
Regression test results show whether existing functionality remained stable after changes, fixes, or enhancements. A successful new feature is not enough if it breaks old behavior. Regression result analysis helps the team understand whether the application is stable as a whole.
When regression failures occur, testers should identify whether they are related to recent changes. If a defect fix in one module breaks another module, this indicates impact analysis or code dependency issues. Regression failures are often more concerning than first-time failures because they show that previously working functionality has degraded.
Regression analysis should prioritize critical flows. If a low-risk formatting issue appears during regression, it may be manageable. If login, order creation, fund transfer, or role-based access fails during regression, release risk increases sharply. The business impact of regression failures matters more than the raw count.
Regression result trends also matter over time. If each new build introduces new regression defects, the application may be unstable. If regression failures decrease across builds, quality is improving. This trend helps stakeholders decide whether more stabilization time is needed.
Analyzing Reopened Defects
Reopened defects are important signals in test result analysis. A defect is reopened when a fix does not resolve the issue or when the same problem reappears after being marked fixed. A high reopened defect count may indicate poor fix quality, unclear requirements, insufficient developer testing, or incomplete defect descriptions.
One reopened defect may not be serious by itself, but repeated reopenings in the same area indicate risk. If payment-related defects are repeatedly reopened, the payment module may need deeper investigation. If defects are reopened because developers cannot reproduce them, the team may need better evidence collection and defect reporting standards.
Reopened defect analysis should examine root causes. Was the original defect description unclear? Was the fix incomplete? Did the developer fix only one scenario but not related scenarios? Did the requirement change during the fix? Understanding why defects reopen helps prevent repeated delays.
Release decisions should consider reopened defects carefully. A defect that has been reopened multiple times may need extra regression and business validation even after it appears fixed. Reopened defects reduce confidence because they show instability in the resolution process.
Build-Wise Test Result Analysis
In most projects, testing occurs across multiple builds. Each build may include new features, defect fixes, configuration changes, or patches. Build-wise analysis compares results across builds to determine whether quality is improving or worsening.
A healthy trend usually shows fewer critical defects, fewer reopened defects, improved pass rates, and reduced blockers over successive builds. If each build introduces new critical defects or breaks previously stable areas, the release may not be ready. Build-wise analysis makes these patterns visible.
Testers should track what changed in each build. Without build context, it is difficult to explain why results changed. A pass rate may drop because a risky feature was added, or it may improve because major defects were fixed. Build notes, defect lists, and change logs help interpret test results accurately.
Build-wise analysis is useful during stabilization. Near release, stakeholders want to see that quality is converging. If late builds continue to show major failures, the team may need to delay release, reduce scope, or add focused testing. Test result analysis provides evidence for that decision.
Module-Wise Test Result Analysis
Module-wise analysis groups results by application area. Instead of only saying that eighty percent of test cases passed overall, testers can say that login is fully passed, profile management has two medium defects, payment has one critical defect, and reporting has several blocked cases. This gives a clearer picture of where the product is strong and where it is risky.
Module-wise analysis is useful because business impact differs by module. A reporting defect may be acceptable for one release if reporting is not critical, while a payment defect may block release. Grouping results by module helps stakeholders evaluate impact in business terms.
This analysis also helps assign ownership. Developers, business analysts, and testers can focus on modules with the most failures. Test leads can prioritize regression or exploratory testing in weak areas. Product owners can decide whether a module should be released, deferred, or restricted.
Module-wise results should include pass, fail, blocked, open defect count, defect severity, and any major risks. This makes the analysis practical rather than just descriptive.
Release Readiness Interpretation
Test result analysis ultimately supports release readiness. Release readiness does not mean that every test case passed and every defect is closed. In real projects, some low-risk defects may remain open. Readiness means that quality is understood, critical risks are controlled, and stakeholders consciously accept any remaining issues.
To interpret readiness, testers should examine critical flow status, open critical and high defects, requirement coverage, blocked cases, regression stability, defect trends, and business approval. A product with no open critical defects, stable regression results, and complete critical coverage is usually closer to release readiness.
If critical defects remain open, major requirements are untested, or regression failures continue, the product is not ready even if the overall pass percentage looks good. Testers should state this clearly. Professional test result analysis prioritizes truth over comfort.
Readiness interpretation should end with a recommendation or risk statement. For example, "Release is recommended after closure of the two high-severity payment defects" or "Release is not recommended because user registration and password reset remain blocked." Such statements help stakeholders act.
Communicating Test Result Analysis
Test result analysis must be communicated in a way that different stakeholders can understand. Developers may need detailed defect trends and failure patterns. Product owners may need business impact and requirement readiness. Project managers may need schedule risk and blocker status. Executives may need a concise release recommendation.
Good communication separates facts, interpretation, and recommendation. Facts include executed cases, pass/fail counts, open defects, and blocked cases. Interpretation explains what those facts mean for quality. Recommendation suggests what action should be taken, such as continue testing, fix blockers, delay release, or proceed with known risk.
Visual summaries can help. Tables, charts, module-wise summaries, severity distribution, and trend graphs make results easier to understand. However, visuals should not hide important context. A chart showing high pass percentage should still mention critical failures if they exist.
Communication should be direct and balanced. Testers should avoid exaggerating minor issues, but they should also avoid softening serious risks. The purpose of analysis is not to make the project look good; it is to help the team make the right decision.
Practical Example: E-Commerce Release Analysis
Consider an e-commerce release where two hundred test cases were planned. One hundred eighty cases were executed, one hundred sixty passed, fifteen failed, and five were blocked. At first glance, the pass rate appears acceptable. However, deeper analysis reveals that three of the failed cases belong to payment processing and two blocked cases belong to refund validation.
The analysis should highlight that payment and refund are high-risk areas because they affect revenue and customer trust. Even though many cases passed, release readiness depends heavily on resolving payment defects and unblocking refund tests. The team may decide that product search and profile defects can be deferred, but payment defects cannot.
Further analysis may show that payment failures occur only for one payment method, while other methods work. This insight helps stakeholders decide whether to disable the affected method temporarily, fix the defect before release, or delay the release. Test result analysis provides options based on evidence.
This example shows why raw numbers are not enough. The true release risk is hidden inside the business impact of failed and blocked cases. Analysis turns execution results into useful decision-making information.
Practical Example: Banking Application Analysis
In a banking application, suppose fund transfer, bill payment, account summary, and statement download are tested. The overall pass rate is eighty-eight percent. No critical defect exists in account summary or statement download, but one high-severity defect exists in fund transfer where the balance is not updated immediately after successful transfer.
This defect is serious because it affects financial accuracy and user trust. Even if most test cases passed, the release may not be acceptable until this issue is fixed and regression tested. The analysis should clearly state that the fund transfer module is a release risk.
Suppose the same cycle has several low-severity UI defects in statement download. These may be deferred if the business agrees. The distinction between critical business impact and cosmetic impact helps stakeholders prioritize correctly.
Banking examples show the importance of severity, module criticality, and data integrity in test result analysis. In high-risk domains, a single serious defect can outweigh many successful test cases.
Test Result Analysis Checklist
A practical checklist helps testers perform consistent analysis. The first item is execution coverage: how many planned cases were executed, how many remain, and whether critical cases are complete. The second item is pass/fail distribution, interpreted with business priority rather than raw percentage alone.
The third item is defect severity and priority. Testers should identify open critical and high defects, reopened defects, and defects affecting release scope. The fourth item is blocked cases. Blocked critical cases should be clearly escalated because they represent unknown risk.
The fifth item is requirement coverage. Testers should confirm whether each important requirement has execution evidence. The sixth item is regression stability. If regression cases fail, the team should understand whether recent changes caused side effects.
The final checklist item is recommendation. Analysis should not end with numbers. It should explain whether testing should continue, whether release is blocked, whether additional regression is needed, or whether remaining defects can be accepted with business approval.
Best Practices for Test Result Analysis
The first best practice is to analyze results regularly, not only at the end of testing. Early analysis helps identify risk while there is still time to act. Waiting until the final day often turns manageable issues into release emergencies.
The second best practice is to combine metrics with judgment. Metrics provide evidence, but human interpretation is required to understand business impact. A mature tester reads the story behind the numbers and explains it clearly.
The third best practice is to keep analysis factual. Avoid assumptions such as "this defect is probably minor" without evidence. If impact is unknown, state that impact needs investigation. Reliable analysis depends on honest language.
The fourth best practice is to highlight risks separately from status. Status tells what happened. Risk tells what could happen if the product is released in its current state. Stakeholders need both.
The fifth best practice is to connect analysis to action. If a module has many failures, recommend focused testing or defect triage. If blocked cases are high, recommend environment escalation. If regression is unstable, recommend delaying release or narrowing scope. Good analysis leads to decisions.
Interview Perspective
Test result analysis is often discussed in manual testing interviews.
A short answer typically defines it as evaluating test execution outcomes to assess software quality.
A detailed answer explains analyzing pass rates, defect severity, and requirement coverage.
Interviewers may ask how analysis influences release decisions.
Demonstrating analytical thinking and risk awareness reflects strong testing capability.
Key Takeaway
Test Result Analysis is the process of evaluating test execution outcomes to understand product quality and stability.
It examines pass rates, defect trends, severity distribution, and requirement coverage to identify risk areas.
Manual testers play a critical role in interpreting results and communicating insights clearly.
Test Result Analysis transforms raw testing outcomes into actionable quality insights, enabling informed release decisions rather than relying on guesswork.