Test Metrics & KPIs – Complete Guide
Software testing is not only about executing test cases and finding defects. Modern software quality assurance requires measuring, analyzing, and improving testing performance using data. Organizations rely on measurable indicators to understand how effective their testing processes are and whether product quality is improving over time.
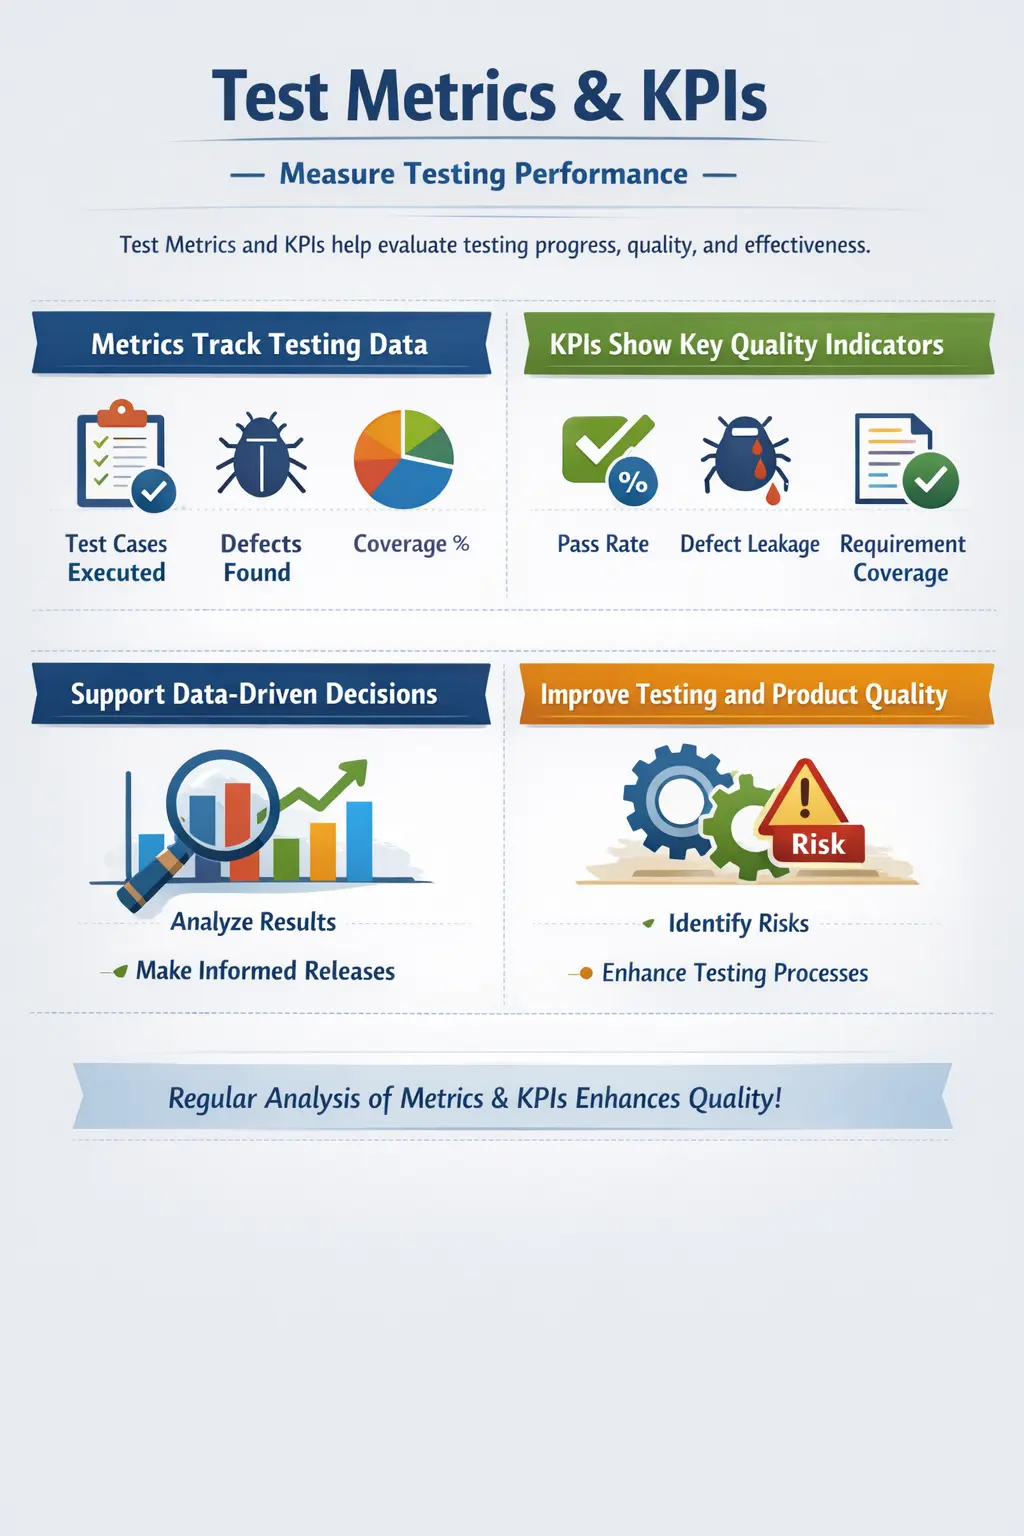
This is where Test Metrics and Key Performance Indicators (KPIs) play a critical role. Test metrics provide quantitative measurements that help teams monitor testing progress, product quality, and process efficiency. KPIs represent a subset of these metrics that are most important for evaluating overall testing success.
Test Metrics and KPIs answer a fundamental question in quality assurance:
“How well is testing performing, and is product quality improving?”
By tracking meaningful metrics and focusing on the right KPIs, organizations can move from intuition-based decisions to data-driven quality management. These measurements help teams identify risks, optimize testing strategies, and provide transparency to stakeholders.
In modern development environments where rapid releases and continuous integration are common, metrics and KPIs have become essential tools for monitoring quality and guiding improvement.
Understanding Test Metrics
Test metrics are numerical measurements that provide insights into different aspects of the testing process. These measurements help evaluate testing progress, productivity, defect trends, and coverage levels.
Metrics help transform testing activities into measurable outcomes. Instead of relying on assumptions or subjective opinions, teams can evaluate testing performance using objective data.
For example, metrics can show how many test cases were executed, how many defects were discovered, and how many requirements were validated through testing.
Test metrics also help teams identify patterns and trends over time. By analyzing these patterns, teams can determine whether software quality is improving or deteriorating.
Metrics are widely used in test management reports, dashboards, and status updates. They help stakeholders understand the current state of testing and make informed decisions about release readiness.
Understanding KPIs in Software Testing
Key Performance Indicators (KPIs) are a selected subset of test metrics that represent the most critical indicators of testing performance and product quality.
While many metrics can be tracked during testing, KPIs focus on the measurements that directly impact business decisions.
KPIs help answer strategic questions such as whether the application is stable enough for release or whether testing is effectively detecting defects.
For example, while a testing team may track hundreds of data points, management may focus only on a few KPIs such as pass rate, defect leakage, and requirement coverage.
KPIs are typically reported to senior stakeholders such as project managers, product owners, and quality assurance leaders.
By focusing on key indicators, organizations can monitor quality trends without becoming overwhelmed by excessive data.
Purpose of Test Metrics and KPIs
The primary purpose of test metrics and KPIs is to measure testing progress and productivity. They provide visibility into how much testing work has been completed and how much remains.
Another important purpose is assessing product quality and risk. Metrics such as defect severity distribution help teams understand whether critical issues remain unresolved.
Metrics also support data-driven decision-making. Instead of relying on subjective judgment, teams can use objective data to determine whether a release is ready.
Transparency is another benefit of metrics and KPIs. Stakeholders receive clear insights into testing progress, defects, and coverage.
Metrics also improve predictability in projects. By analyzing historical data, teams can estimate testing effort and timelines more accurately.
Finally, metrics enable continuous improvement. By reviewing testing performance regularly, teams can identify weaknesses in their processes and implement improvements.
Difference Between Metrics and KPIs
Although the terms are often used interchangeably, test metrics and KPIs serve different purposes.
Metrics represent all measurable data points collected during testing. They provide detailed insights into testing activities.
KPIs represent the most important metrics used to evaluate overall performance and quality impact.
Metrics are typically numerous and detailed, while KPIs are limited and strategic.
For example, a testing team may track the number of test cases executed daily as a metric. However, management may focus on pass rate as a KPI because it indicates build stability.
Metrics provide raw data, while KPIs help interpret that data for decision-making.
Understanding the distinction between metrics and KPIs helps teams focus on meaningful measurements rather than excessive data collection.
Core Test Metrics in Manual Testing
Testing teams commonly track several categories of metrics to monitor different aspects of the testing process.
Test Case Metrics
Test case metrics measure the progress of test execution activities. They provide insights into how much testing work has been completed.
One commonly tracked metric is the number of planned versus executed test cases. This metric indicates how much progress has been made relative to the testing plan.
Another important metric is the distribution of test results, including passed, failed, and blocked test cases.
Execution progress percentage is also widely used. This metric shows the percentage of planned test cases that have been executed.
These metrics help teams understand the stability of the application and whether testing activities are progressing as planned.
Test case metrics are often included in daily status reports and execution dashboards.
Defect Metrics
Defect metrics help evaluate product quality by analyzing defect trends and characteristics.
Defect density measures the number of defects relative to the size or complexity of the application.
Severity distribution categorizes defects based on their impact, such as critical, high, medium, or low severity.
Defect leakage measures the percentage of defects that escape testing and are discovered in production.
Defect rejection rate measures how many reported defects are rejected as invalid.
Defect aging measures how long defects remain unresolved.
These metrics help teams understand the effectiveness of testing and identify areas of risk.
Defect metrics are particularly important for assessing product quality before release.
Coverage Metrics
Coverage metrics measure how much of the application has been validated through testing.
Requirement coverage indicates the percentage of requirements that have been tested.
Scenario coverage measures whether business workflows and use cases have been validated.
Risk coverage evaluates whether high-risk areas of the application have received sufficient testing attention.
Coverage metrics help teams identify gaps in testing and ensure that critical functionality is not overlooked.
High coverage levels increase confidence in the completeness of testing.
Productivity Metrics
Productivity metrics evaluate testing efficiency and resource utilization.
Examples include the number of test cases designed per day or the number of test cases executed per tester.
Another productivity metric is the number of defects detected by each tester.
These metrics can help teams understand testing capacity and workload distribution.
However, productivity metrics should be interpreted carefully because they may not accurately reflect testing quality.
Testing effectiveness should always be prioritized over quantity.
Common Testing KPIs
While many metrics are collected during testing, organizations focus on a few key indicators that represent overall quality and testing effectiveness.
Pass Rate
Pass rate measures the percentage of executed test cases that pass successfully.
It is calculated by dividing the number of passed test cases by the total number of executed test cases.
Pass rate provides insights into application stability and build quality.
A high pass rate generally indicates that the application is functioning correctly.
However, pass rate should be interpreted alongside defect severity and coverage metrics.
Defect Leakage
Defect leakage measures the percentage of defects that escape testing and are discovered after release.
It is calculated by dividing the number of production defects by the total number of defects identified.
Low defect leakage indicates that testing activities were effective in detecting issues before release.
High defect leakage suggests gaps in testing coverage or test design.
This KPI is one of the most important indicators of testing effectiveness.
Defect Removal Efficiency
Defect Removal Efficiency (DRE) measures the percentage of defects detected and resolved before the product is released.
It is calculated by dividing the number of pre-release defects by the total number of defects.
High DRE indicates strong quality control and effective defect detection.
Organizations often track this KPI to evaluate the overall effectiveness of their testing processes.
Requirement Coverage KPI
Requirement coverage measures the percentage of documented requirements that have been tested.
High requirement coverage ensures that the application's intended functionality has been validated.
Low coverage may indicate missing test scenarios or incomplete testing.
This KPI helps teams determine whether testing has addressed all functional requirements.
Mean Time to Fix
Mean Time to Fix measures the average time required to resolve defects after they are reported.
Shorter resolution times indicate efficient collaboration between development and testing teams.
Longer resolution times may signal process inefficiencies or resource constraints.
This KPI helps organizations evaluate the responsiveness of defect resolution processes.
Manual Tester’s Role in Metrics and KPIs
Manual testers contribute significantly to the accuracy and usefulness of test metrics and KPIs.
One of their key responsibilities is capturing accurate execution data during testing activities.
Testers must also log defects with correct severity and status so that defect metrics remain reliable.
Another important responsibility is updating testing metrics consistently throughout the testing cycle.
Testers also play a role in interpreting metrics. Numbers alone do not always provide complete insights, so testers must explain the context behind metrics.
For example, a sudden drop in pass rate may be caused by an unstable build rather than poor testing performance.
By providing accurate data and meaningful interpretation, testers help ensure that metrics support effective decision-making.
Using Metrics Effectively
Metrics are most valuable when they are used to analyze trends rather than isolated data points.
Reviewing metrics over time helps teams identify patterns and detect potential quality issues early.
Metrics should also be combined with qualitative insights such as tester observations and risk assessments.
Another best practice is avoiding the use of metrics to compare individual testers. Testing performance is influenced by many factors, including feature complexity and project scope.
Metrics should be aligned with business goals. For example, a system handling financial transactions may prioritize defect leakage and risk coverage metrics.
Regular review of metrics helps teams continuously improve their testing processes.
Common Pitfalls in Metrics Usage
Despite their benefits, metrics can sometimes be misused.
One common issue is focusing on vanity metrics that provide numbers but do not influence decision-making.
Another mistake is overemphasizing pass rate alone without considering defect severity or business impact.
Metrics can also become counterproductive if they are used as tools for blame rather than improvement.
Teams should use metrics to understand problems and drive process improvements rather than to assign fault.
Balanced interpretation of metrics is essential for maintaining a healthy testing culture.
Example KPI Snapshot
Consider a project preparing for release with the following KPI values.
The pass rate is ninety-four percent, indicating that most executed test cases passed successfully.
There are no critical defects remaining open in the system.
Defect leakage is measured at two percent, suggesting that very few defects escaped testing.
Requirement coverage is ninety-eight percent, meaning that nearly all requirements have been validated.
These metrics suggest that the application is stable and ready for release with minimal residual risk.
Such KPI snapshots help stakeholders evaluate release readiness objectively.
Interview-Ready Explanation
During testing interviews, candidates may be asked to explain test metrics and KPIs.
A concise explanation describes test metrics as quantitative measurements used to track testing progress and quality.
A more detailed explanation describes how metrics provide data about testing activities, while KPIs focus on critical indicators that influence management decisions.
Examples such as pass rate, defect leakage, and requirement coverage demonstrate practical understanding.
Understanding metrics and KPIs shows that a tester can evaluate testing effectiveness and contribute to quality improvement.
Key Takeaway
Test metrics and KPIs provide measurable insights into testing progress, product quality, and process effectiveness.
Metrics capture detailed data about testing activities, while KPIs highlight the most critical indicators that influence release decisions.
When used correctly, these measurements enable data-driven decision-making, improve transparency, and support continuous improvement in software testing.
Ultimately, metrics measure activity, while KPIs measure impact. Together, they help organizations ensure that testing delivers meaningful value and contributes to delivering high-quality software.